Dashboards
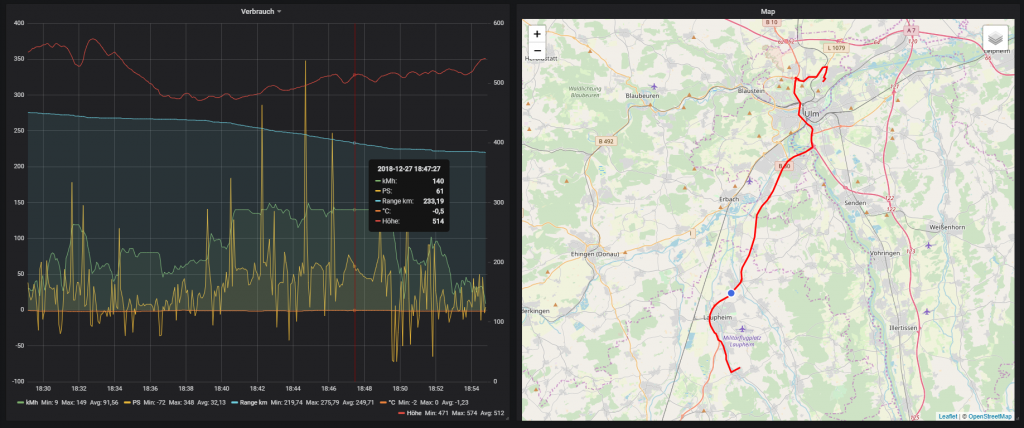
Consumption
Data for a trip, including range, position, retrieved power, speed and some other data.
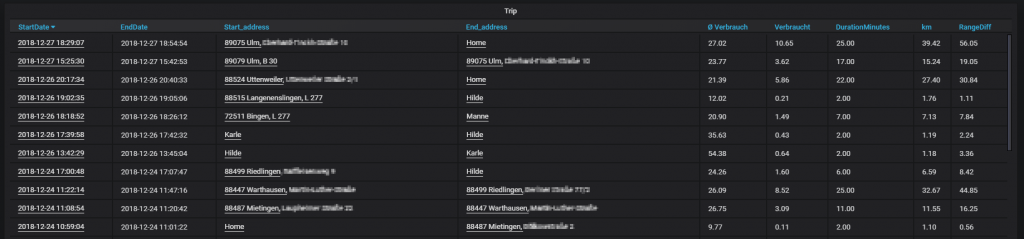
Trips
Trips with time, start and destination, and some further details such as average consumption and power demand. By clicking on the start time, you land in the upper evaluation "Consumption":
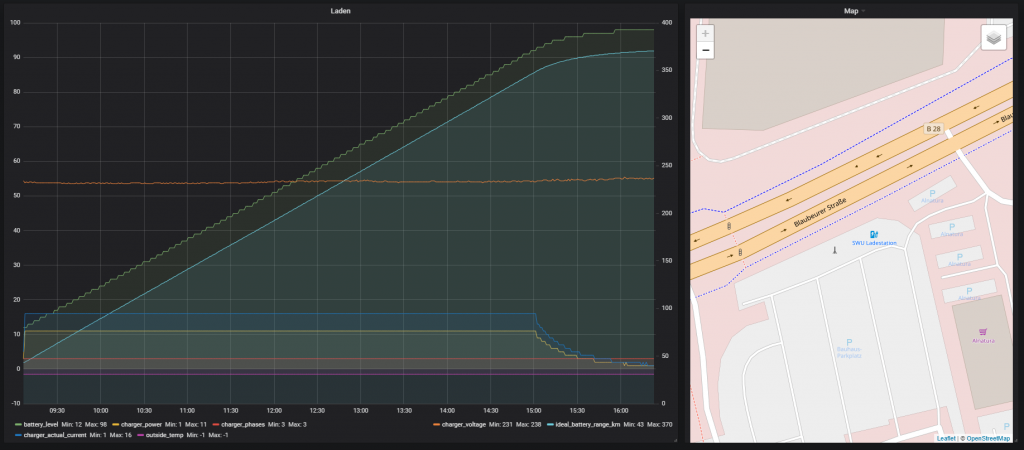
Charging
Shows the course of a charging session. This is a good way to determine the change in charging power compared to the battery state:
Charging History
Shows all charging sessions with location, time, the charged power, and further details. A click on the start date leads to the "Charging" evaluation.
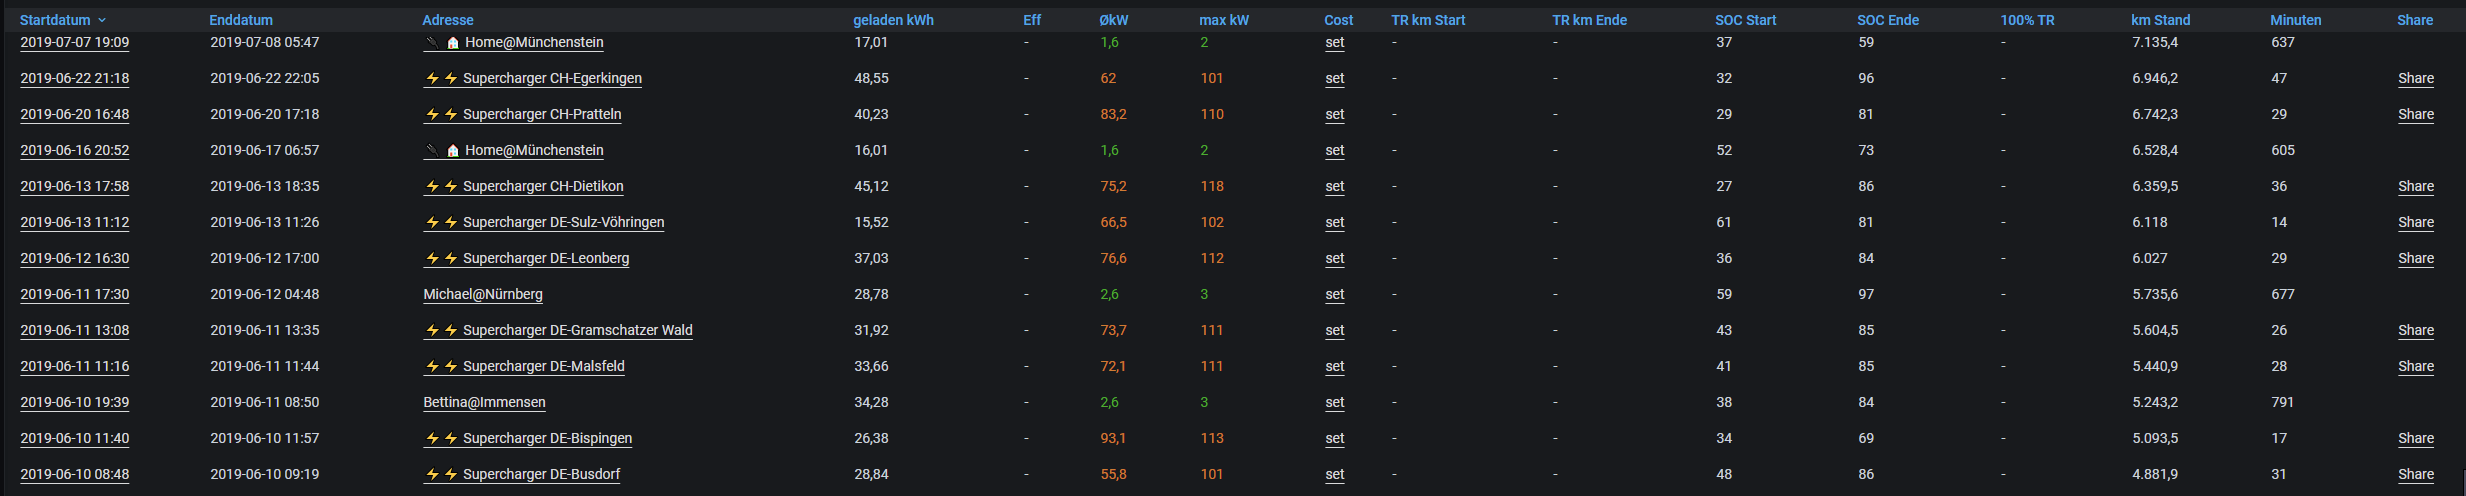
By clicking on an entry in the "Cost" column, the costs for the charging session can be recorded. The displayed value "set" means that no costs have been defined yet. The following dialog is then shown:
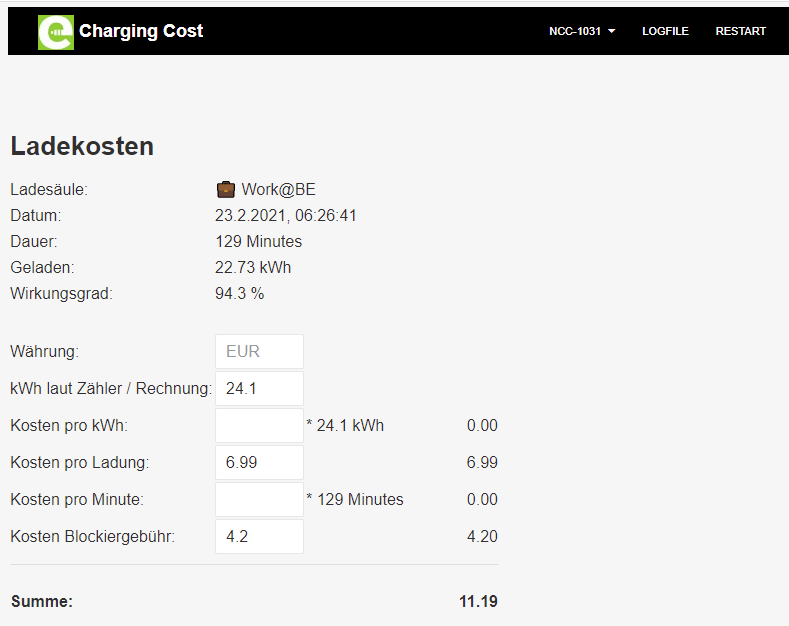
If no costs were incurred, the entry "0" must be made in the "Cost per charge" field. Otherwise, the other fields should be filled in if relevant. Irrelevant fields are simply left empty (no value). Charging sessions at Tesla Superchargers can be published and shared via the "Share" button on the far right. The respective charging curve of the session is displayed.
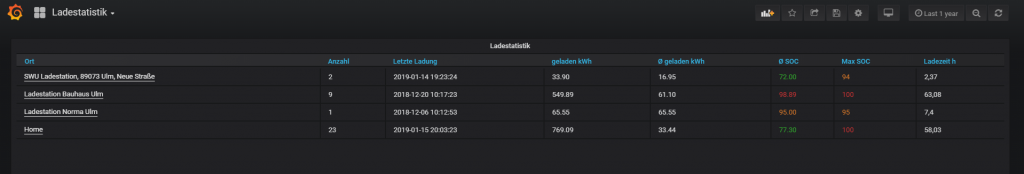
Charging Statistics
Here the various locations and their frequency, along with a few other details, are shown where charging took place:
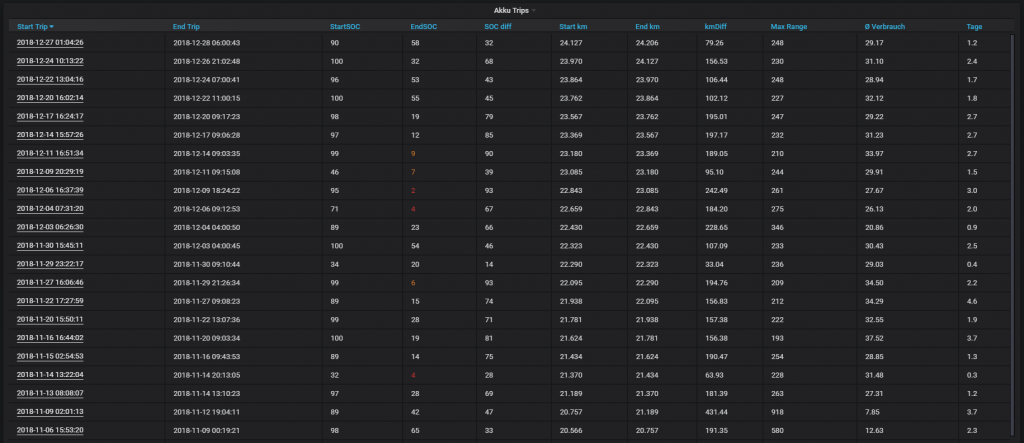
Battery Trips
Here the distances covered between two charging sessions are shown. A click on the start date leads back to the first evaluation "Consumption" with the corresponding time period set.
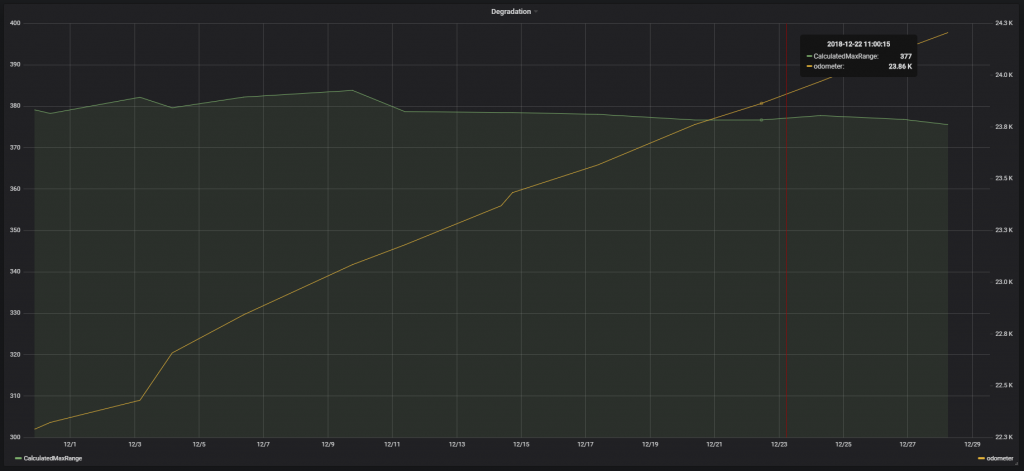
Degradation
Here the range is shown in connection with the kilometers driven so far and thus the loss of possible range over time:
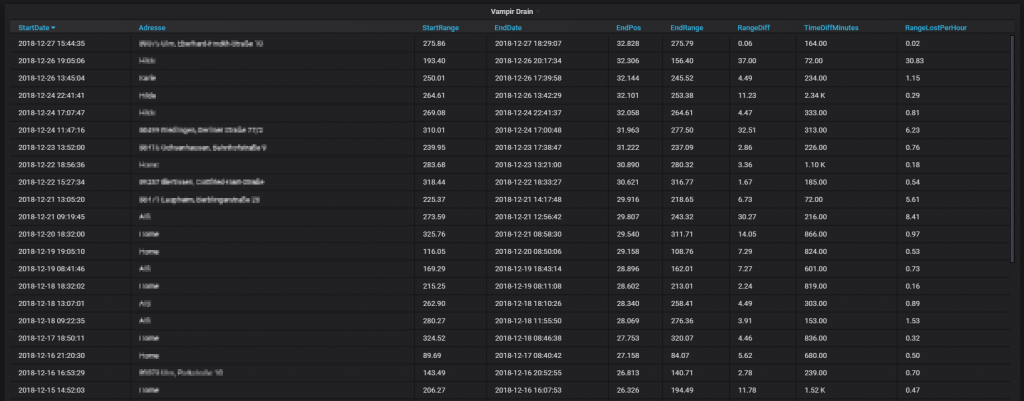
Vampire Drain
"Vampire Drain" refers to the charging loss while stationary, i.e. between two trips.
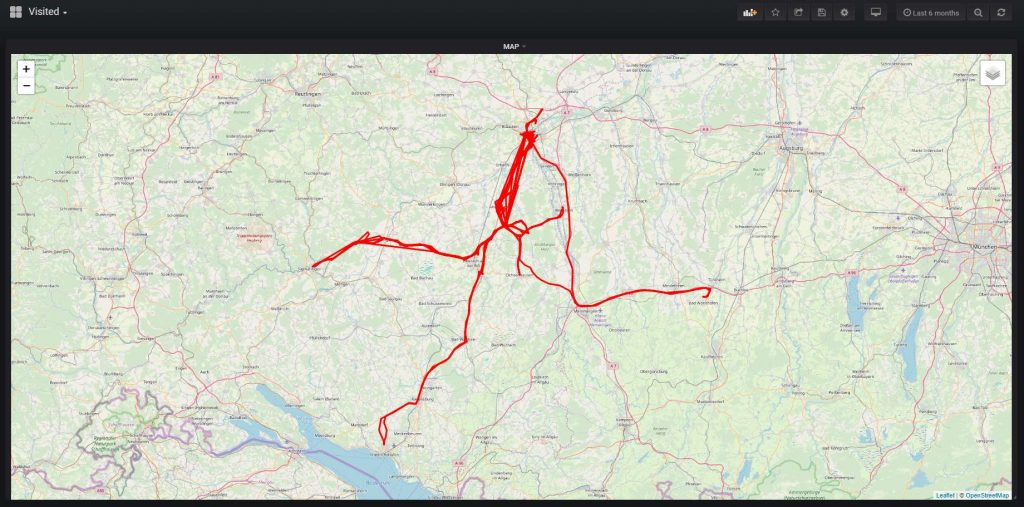
Visited
Visited places in a defined period.
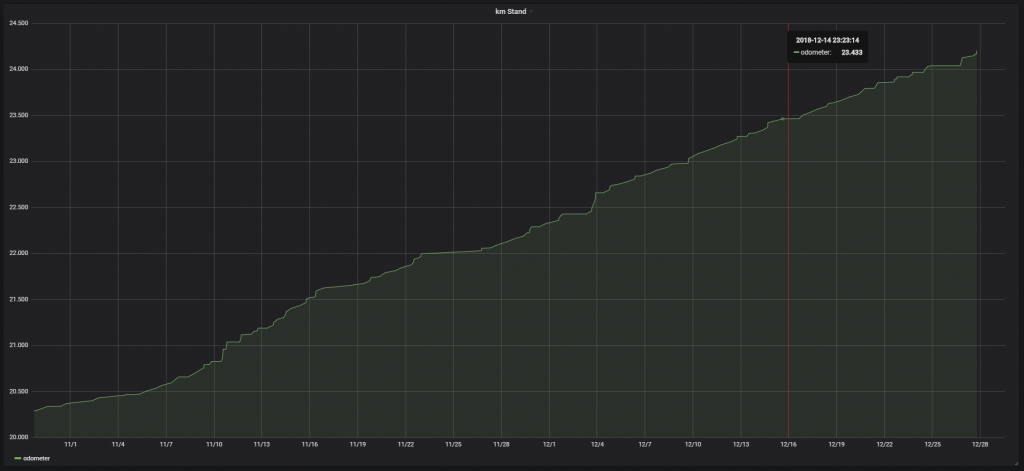
Odometer
The time course of the kilometers driven:
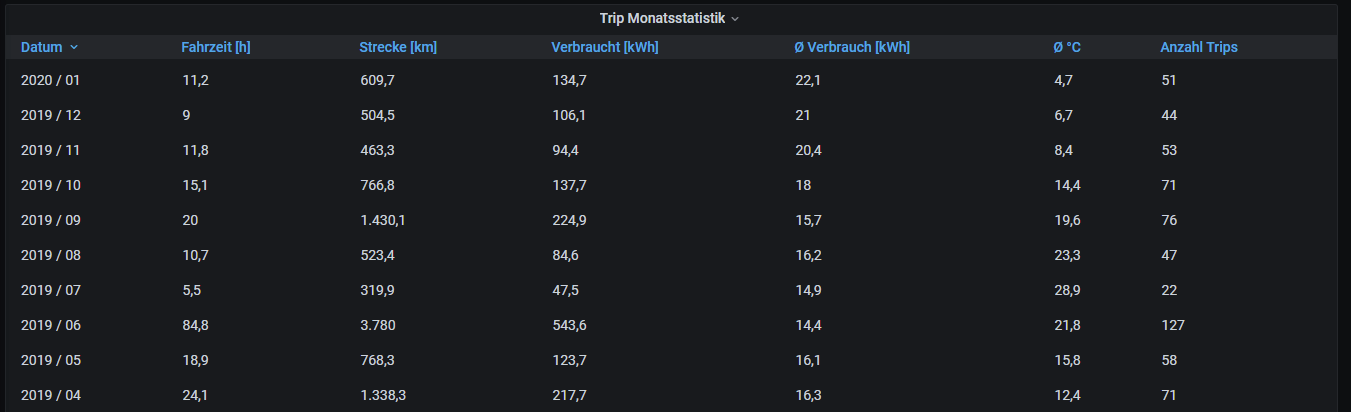
Trip Monthly Statistics