Usage
In the previous section, we logged into Grafana and landed on a presumably empty page with the title "Consumption". Next to the name, there is a small arrow; if you press here, a list of all available evaluations that TeslaLogger provides appears.
Define Favorites
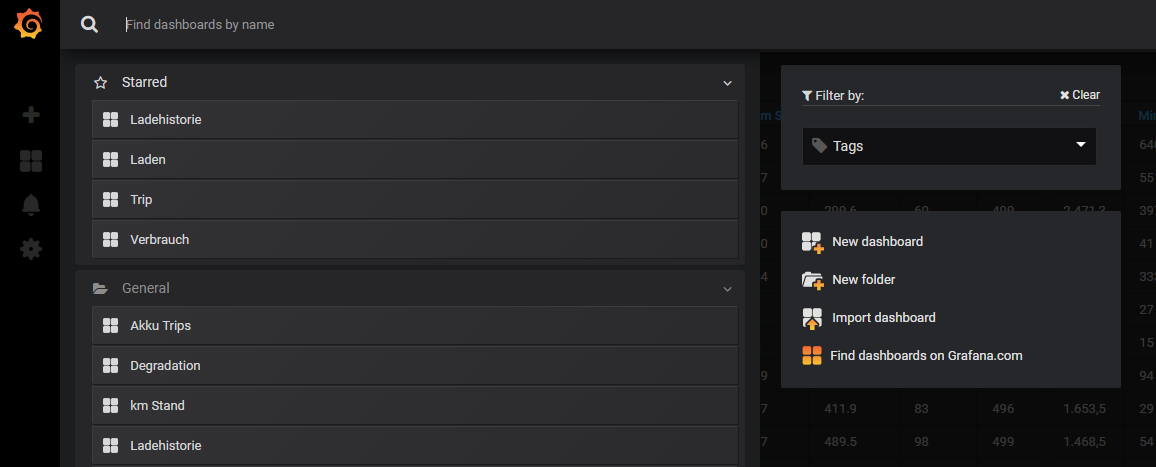
To have the evaluations important for your own needs at the top of the list, you just have to select the evaluation and then select the star icon. After defining some evaluations, the list can then look as follows (the favorites are at the top as "Starred"):
Working with the Evaluations
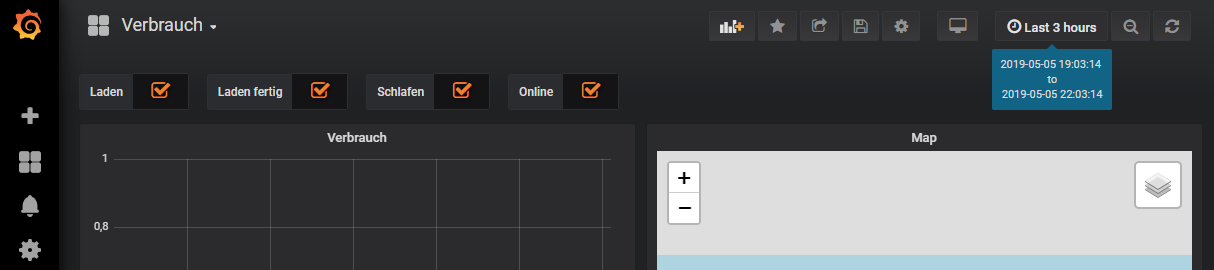
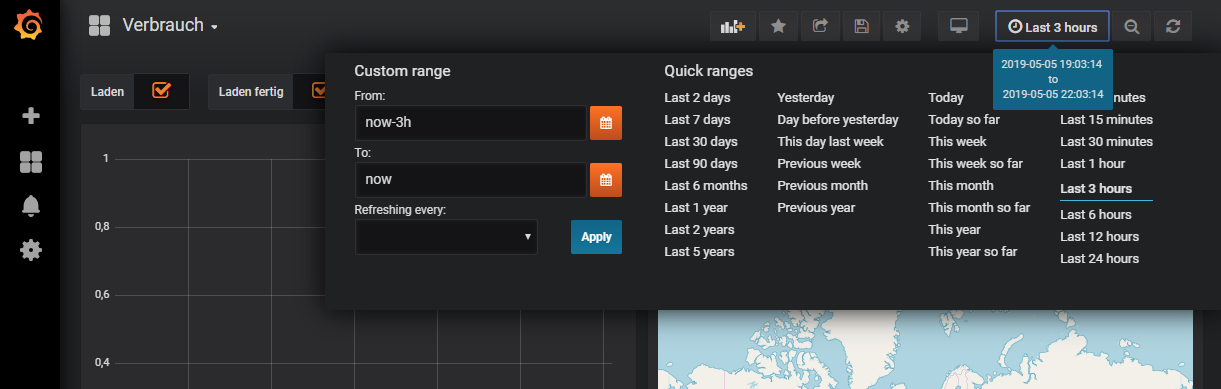
The essential function for configuring the evaluations is to define the point in time. There are two variants for this. The first variant is to define the time period manually. Click on the time range, which is shown here in the example at the top right as "Last 3 hours":
There is now the option to choose one of the various prepared selection options such as "Today" or "Yesterday" or to define this freely yourself in the "Custom range" area:
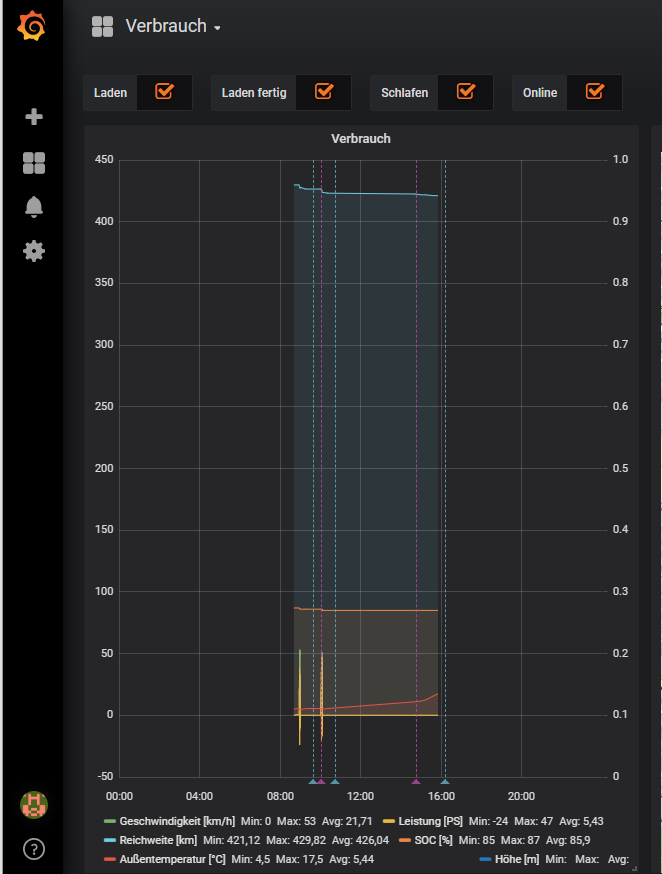
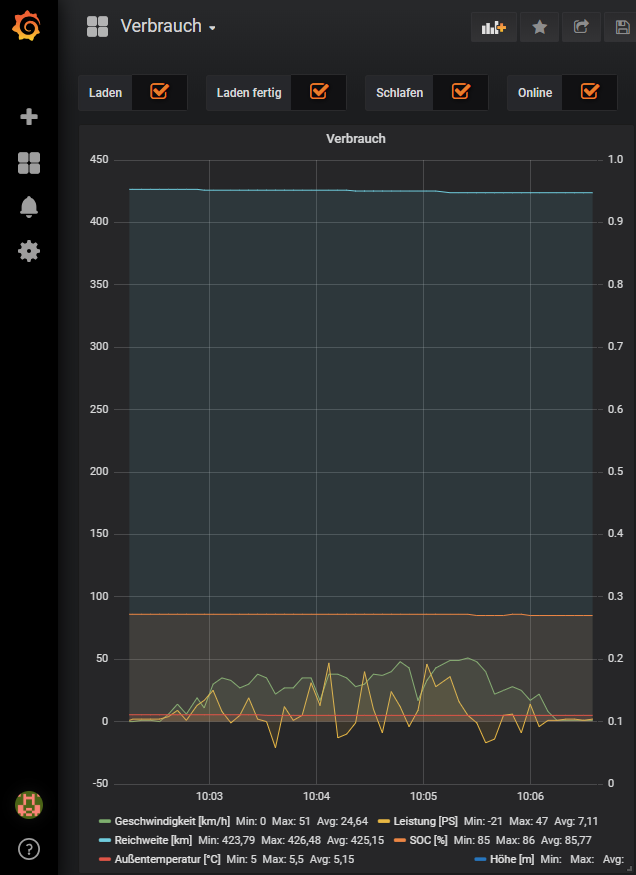
Once data is displayed, this selection can be refined with the mouse. In the example below, two short trips are visible from the "Consumption" evaluation. By selecting the area of the 2nd trip, it can be displayed in detail and thus zoomed in by simply clicking the start somewhere in the graphical area and then moving to the end with the mouse button pressed: